 OSURIS
2022
GEMET keywords
Type of resources
Available actions
Topics
INSPIRE themes
Keywords
Contact for the resource
Provided by
Years
Formats
Representation types
Update frequencies
status
Scale
Resolution
-
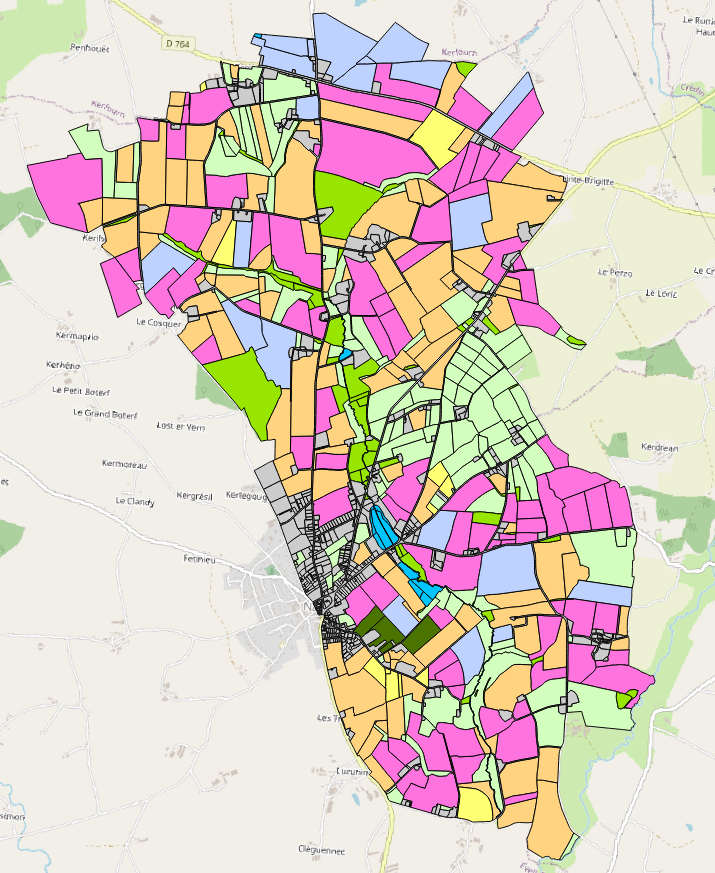
Occupation des sols 2000 du bassin versant du site de Naizin dans le Morbihan dans le cadre de l'Observatoire de Recherche en Environnement (ORE) AgrHyS d'INRAE. Le parcellaire est issu du cadastre de 2013. Les dessertes ont été redessinées à partir des orthophotos IGN de 2013 et le parcellaire a été découpé en fonction d’une zone tampon autour de ces dessertes. Les parcelles 2013 peuvent être découpées mais jamais regroupées. Toutes les entités géographiques élémentaires ont un identifiant unique sur l’ensemble des années. Champs de la table d’attribut : • ID_2000 : identifiant de la parcelle pour l’année 2000 • TYPE : code principal de l’occupation des sols • S_TYPE : code secondaire de l’occupation des sols La nomenclature de ces codes des types et sous-types a été définie dans le programme ANR-12-AGRO-0005 MOSAIC : https://anr.fr/Projet-ANR-12-AGRO-0005. Leurs descriptions peuvent être télécharger ici : https://geosas.fr/metadata/ore/xls/legendes_osol_naizin.xlsx. Les occupations des sols sont issues de photo-interprétation dans le cadre du programme CORMORAN (Cheverry et al., 1998). Les limites des parcelles ont été mises en concordance avec le parcellaire de 2013.
-
Occupation des sols 2007 du bassin versant du site de Naizin dans le Morbihan dans le cadre de l'Observatoire de Recherche en Environnement (ORE) AgrHyS d'INRAE. Le parcellaire est issu du cadastre de 2013. Les dessertes ont été redessinées à partir des orthophotos IGN de 2013 et le parcellaire a été découpé en fonction d’une zone tampon autour de ces dessertes. Les parcelles 2013 peuvent être découpées mais jamais regroupées. Toutes les entités géographiques élémentaires ont un identifiant unique sur l’ensemble des années. Champs de la table d’attribut : • ID_2007 : identifiant de la parcelle pour l’année 2007 • TYPE_07 : code principal de l’occupation des sols • S_TYPE_07 : code secondaire de l’occupation des sols • ID_ILOT : Identifiant numérique et non significatif par îlot du RPG 2007 • CODE_GROUP : code du groupe de cultures du RPG 2007 La nomenclature de ces codes des types et sous-types a été définie dans le programme ANR-12-AGRO-0005 MOSAIC : https://anr.fr/Projet-ANR-12-AGRO-0005. Leurs descriptions peuvent être télécharger ici : https://geosas.fr/metadata/ore/xls/legendes_osol_naizin.xlsx. Les occupations des sols sont issues des données par ilot du Registre Parcellaire Graphique (RPG) de l’année 2007. Les limites des parcelles ont été mises en concordance avec le parcellaire de 2013.
-
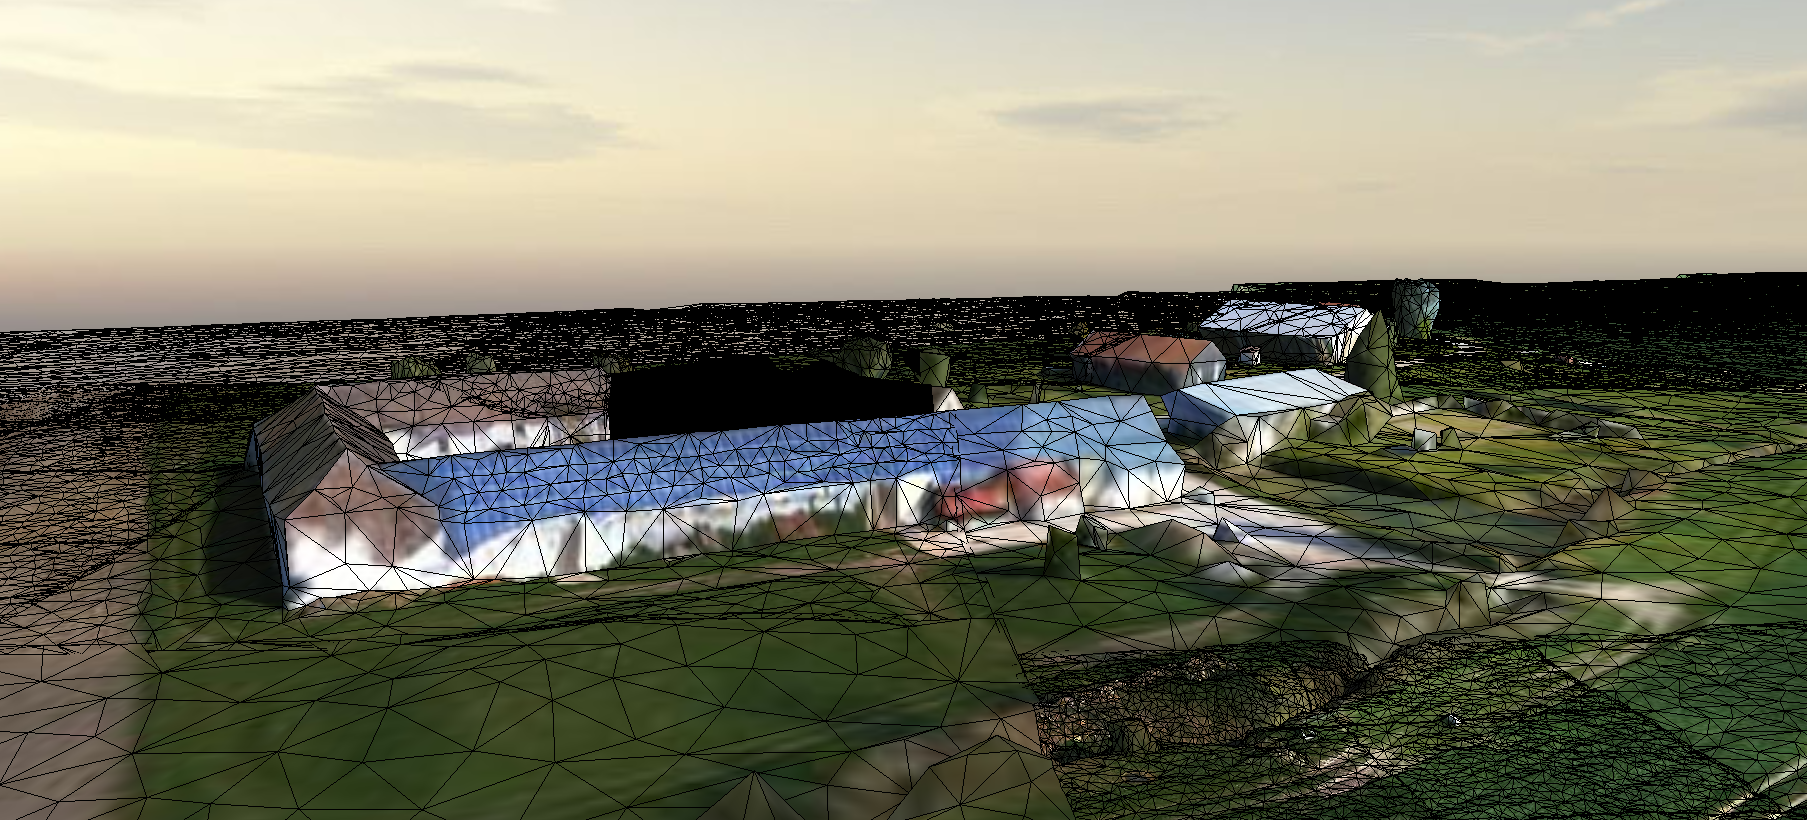
Survol d'une partie du Ru des Effervettes,en limite des communes de Nangis et Fontains, dans le département de la Seine et Marne. Les données ont été acquises par drone anafiet restituées en un maillaige tridimentionnel (mesh).
-

La vallée de la Sélune subit actuellement d’importants changements dans la morphologie de ses berges et de son cours d’eau. Ainsi, l’analyse des interactions entre zone aquatique et zone riveraine dans ce contexte de restauration représente une opportunité scientifique unique de compréhension des mécanismes écologiques qui sous-tendent non seulement la résilience, mais aussi le fonctionnement global des écosystèmes. Le projet « interaction entre zones aquatiques et riveraines » (RestaurE) étudie le rétablissement du fonctionnement des écosystèmes de la Sélune (résilience). Il considère les interactions entre la morphologie du fleuve, la recolonisation de l’eau et des berges par la végétation et par les espèces d’invertébrés aquatiques et terrestres. Ce projet de recherche a pour objectif d’amorcer l’analyse des néo-habitats issus de la restauration de la Sélune en se concentrant sur les interactions terrestres/aquatiques au niveau des interfaces riveraines. Il permettra ainsi de comprendre le rôle spécifique de ces interactions dans le processus de résilience des écosystèmes en restauration. L’étude des interactions entre zones aquatiques et riveraines sur la Sélune est réalisée sous deux angles : (1) Caractériser le fonctionnement bio-géo-morphologique du cours d’eau et de ses berges ; (2) Étudier le fonctionnement des réseaux trophiques (aquatiques et terrestres). Cette couche donne la localisation des secteurs d'étude utilisés dans le cadre du projet "RestaurE".
-
Occupation des sols 2020 du bassin versant du site de Naizin dans le Morbihan dans le cadre de l'Observatoire de Recherche en Environnement (ORE) AgrHyS d'INRAE. Le parcellaire est issu du cadastre de 2013. Les dessertes ont été redessinées à partir des orthophotos IGN de 2013 et le parcellaire a été découpé en fonction d’une zone tampon autour de ces dessertes. Les parcelles 2013 peuvent être découpées mais jamais regroupées. Toutes les entités géographiques élémentaires ont un identifiant unique sur l’ensemble des années. Champs de la table d’attribut : • ID_2020 : identifiant de la parcelle pour l’année 2020 • TYPE_20 : code principal de l’occupation des sols • S_TYPE_20 : code secondaire de l’occupation des sols • ID_PARCEL : Identifiant numérique et non significatif par parcelle du RPG 2020 • CODE_GROUP : code du groupe de cultures du RPG 2020 • CODE_CULTU : code du groupe de cultures majoritaire du RPG 2020 • CULTURE_D1 : code de la culture dérobée (culture intercalée entre 2 moissons de culture principale) sur la parcelle. • CULTURE_D2 : code de la seconde culture dérobée (culture intercalée entre 2 moissons de culture principale). La nomenclature de ces codes des types et sous-types a été définie dans le programme ANR-12-AGRO-0005 MOSAIC : https://anr.fr/Projet-ANR-12-AGRO-0005. Leurs descriptions peuvent être télécharger ici : https://geosas.fr/metadata/ore/xls/legendes_osol_naizin.xlsx. Les occupations des sols sont issues des données par parcelles du Registre Parcellaire Graphique (RPG) de l’année 2020. Les limites des parcelles ont été mises en concordance avec le parcellaire de 2013.
-
Occupation des sols 2014 du bassin versant du site de Naizin dans le Morbihan dans le cadre de l'Observatoire de Recherche en Environnement (ORE) AgrHyS d'INRAE. Le parcellaire est issu du cadastre de 2013. Les dessertes ont été redessinées à partir des orthophotos IGN de 2013 et le parcellaire a été découpé en fonction d’une zone tampon autour de ces dessertes. Les parcelles 2013 peuvent être découpées mais jamais regroupées. Toutes les entités géographiques élémentaires ont un identifiant unique sur l’ensemble des années. Champs de la table d’attribut : • ID_2014 : identifiant de la parcelle pour l’année 2014 • TYPE_14 : code principal de l’occupation des sols • S_TYPE_14 : code secondaire de l’occupation des sols • NUM_ILOT : Identifiant numérique et non significatif par îlot du RPG 2014 • CODE_GROUP : code du groupe de cultures du RPG 2014 • CODE_CULTU : code du groupe de cultures majoritaire du RPG 2014 La nomenclature de ces codes des types et sous-types a été définie dans le programme ANR-12-AGRO-0005 MOSAIC : https://anr.fr/Projet-ANR-12-AGRO-0005. Leurs descriptions peuvent être télécharger ici : https://geosas.fr/metadata/ore/xls/legendes_osol_naizin.xlsx. Les occupations des sols sont issues de relevés de terrain fait par les agents de l’UMR SAS et les données par îlot du Registre Parcellaire Graphique (RPG) 2014. Les limites des parcelles ont été mises en concordance avec le parcellaire de 2013.
-
Occupation des sols 2008 du bassin versant du site de Naizin dans le Morbihan dans le cadre de l'Observatoire de Recherche en Environnement (ORE) AgrHyS d'INRAE. Le parcellaire est issu du cadastre de 2013. Les dessertes ont été redessinées à partir des orthophotos IGN de 2013 et le parcellaire a été découpé en fonction d’une zone tampon autour de ces dessertes. Les parcelles 2013 peuvent être découpées mais jamais regroupées. Toutes les entités géographiques élémentaires ont un identifiant unique sur l’ensemble des années. Champs de la table d’attribut : • ID_2008 : identifiant de la parcelle pour l’année 2008 • TYPE_08 : code principal de l’occupation des sols • S_TYPE_08: code secondaire de l’occupation des sols • ID_ILOT : Identifiant numérique et non significatif par îlot du RPG 2008 • CODE_GROUP : code du groupe de cultures du RPG 2008 La nomenclature de ces codes des types et sous-types a été définie dans le programme ANR-12-AGRO-0005 MOSAIC : https://anr.fr/Projet-ANR-12-AGRO-0005. Leurs descriptions peuvent être télécharger ici : https://geosas.fr/metadata/ore/xls/legendes_osol_naizin.xlsx. Les occupations des sols sont issues des données par ilot du Registre Parcellaire Graphique (RPG) de l’année 2008. Les limites des parcelles ont été mises en concordance avec le parcellaire de 2013.
-
Occupation des sols 2018 du bassin versant du site de Naizin dans le Morbihan dans le cadre de l'Observatoire de Recherche en Environnement (ORE) AgrHyS d'INRAE. Le parcellaire est issu du cadastre de 2013. Les dessertes ont été redessinées à partir des orthophotos IGN de 2013 et le parcellaire a été découpé en fonction d’une zone tampon autour de ces dessertes. Les parcelles 2013 peuvent être découpées mais jamais regroupées. Toutes les entités géographiques élémentaires ont un identifiant unique sur l’ensemble des années. Champs de la table d’attribut : • ID_2018 : identifiant de la parcelle pour l’année 2018 • TYPE_18 : code principal de l’occupation des sols • S_TYPE_18 : code secondaire de l’occupation des sols • ID_PARCEL : Identifiant numérique et non significatif par parcelle du RPG 2018 • CODE_GROUP : code du groupe de cultures du RPG 2018 • CODE_CULTU : code du groupe de cultures majoritaire du RPG 2018 • CULTURE_D1 : code de la culture dérobée (culture intercalée entre 2 moissons de culture principale) sur la parcelle. • CULTURE_D2 : code de la seconde culture dérobée (culture intercalée entre 2 moissons de culture principale). La nomenclature de ces codes des types et sous-types a été définie dans le programme ANR-12-AGRO-0005 MOSAIC : https://anr.fr/Projet-ANR-12-AGRO-0005. Leurs descriptions peuvent être télécharger ici : https://geosas.fr/metadata/ore/xls/legendes_osol_naizin.xlsx. Les occupations des sols sont issues des données par parcelles du Registre Parcellaire Graphique (RPG) de l’année 2018. Les limites des parcelles ont été mises en concordance avec le parcellaire de 2013.
-
Occupation des sols 1998 du bassin versant du site de Naizin dans le Morbihan dans le cadre de l'Observatoire de Recherche en Environnement (ORE) AgrHyS d'INRAE. Le parcellaire est issu du cadastre de 2013. Les dessertes ont été redessinées à partir des orthophotos IGN de 2013 et le parcellaire a été découpé en fonction d’une zone tampon autour de ces dessertes. Les parcelles 2013 peuvent être découpées mais jamais regroupées. Toutes les entités géographiques élémentaires ont un identifiant unique sur l’ensemble des années. Champs de la table d’attribut : • ID_1998 : identifiant de la parcelle pour l’année 1998 • TYPE : code principal de l’occupation des sols • S_TYPE : code secondaire de l’occupation des sols La nomenclature de ces codes des types et sous-types a été définie dans le programme ANR-12-AGRO-0005 MOSAIC : https://anr.fr/Projet-ANR-12-AGRO-0005. Leurs descriptions peuvent être télécharger ici : https://geosas.fr/metadata/ore/xls/legendes_osol_naizin.xlsx. Les occupations des sols sont issues de photo-interprétation dans le cadre du programme CORMORAN (Cheverry et al., 1998). Les limites des parcelles ont été mises en concordance avec le parcellaire de 2013.
-

La restauration des continuités écologiques sur la Sélune suite à l’effacement du dernier barrage va provoquer des changements majeurs sur le cours d’eau et ses berges. L’ouverture du barrage de La-Roche-Qui-Boit va impliquer des changements sur la biodiversité du cours d’eau, notamment sur les communautés piscicoles avec le retour des poissons migrateurs. Les communautés piscicoles sont inventoriées par analyse d’ADN environnemental (ADNe) sur plusieurs dizaines de stations, réparties sur le cours principal et les affluents. Le marqueur génétique utilisé (ADN mitochondrial 12S) permet de détecter la présence des espèces de migrateurs (indice de présence/absence et taux de détectabilité) tout en analysant l’évolution des communautés de poissons dans leur ensemble au cours du processus de restauration. Cette couche donne la localisation des secteurs d'étude utilisés dans le suivi des communautés piscicoles par analyse d'ADN environnemental, réalisé dans le cadre de l'Observatoire Sélune depuis 2022.