 OSURIS
GEMET keywords
Type of resources
Available actions
Topics
INSPIRE themes
Keywords
Contact for the resource
Provided by
Years
Formats
Representation types
Update frequencies
status
Service types
Scale
Resolution
-

Le rétablissement du continuum fluvial de la Sélune après l’arasement des barrages permettra la colonisation de l’amont du bassin anciennement inaccessible aux anguilles. Avant l'arasement, deux affluents principaux étaient utilisés par les poissons amphihalins pour leur reproduction, en plus du cours principal : le Beuvron et l'Oir. La population d’anguille de la Sélune a été suivie en phase pré-arasement par des campagnes d’indice d’abondance effectuées en 2013, 2015, 2019, puis chaque année depuis 2021, sur un réseau de stations couvrant l’ensemble du réseau hydrographique de la Sélune. Ces données permettent d’estimer l’évolution de l’abondance des anguilles le long de la Sélune et de ses affluents et leur structuration en taille avant et après la destruction des barrages. L’inventaire est réalisé début septembre, une année sur deux, puis chaque année depuis 2021, à l'aide d'un dispositif de pêche électrique et d'épuisettes. Trente points de pêche de trente secondes minimum sont réalisés. Une station de pêche comprend environ 100 mètres de linéaire de cours d’eau. Toutes les anguilles pêchées sont anesthésiées et font l’objet de mesures biométriques (poids, longueur, diamètre oculaire horizontal, vertical, détermination du stade jaune ou argentée). L’ensemble des anguilles est relâché directement sur le site de pêche. Cette fiche fait référence à deux couches, l'une ne donnant que les secteurs d'étude et leur localisation et l'autre y précisant la notion de session de capture.
-
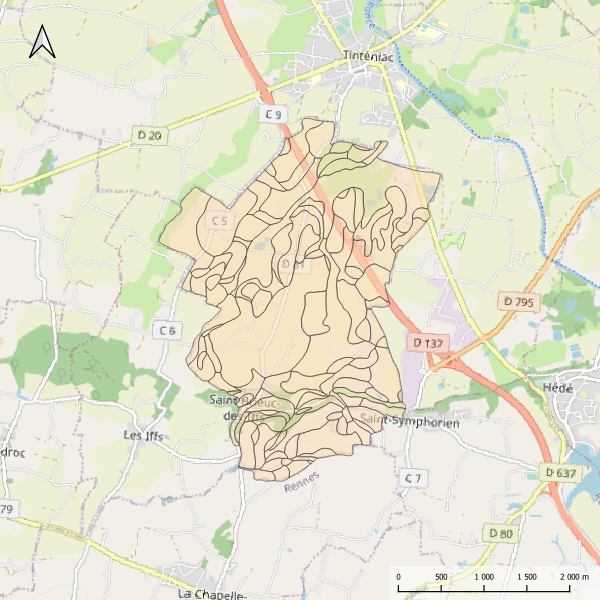
Carte pédologique de Saint-Brieuc-des-Iffs au 1/25000. La codification correspond au code 4 critères des sols du Massif armoricain (voir ressources en ligne). Les champs de la table attributaire sont : - SUB : Matériau(x) parental(ux) à partir du(des)quel(s) se développe le sol - HYD : Classe d'hydromorphie, de 0 (sol bien drainé) à 9 (sol extrêmement hydromorphie) - TYPE : Développement de profil défini à partir de la succession des horizons - PROF : Profondeur du sol, classée de 1 (sols très épais) à 6 (sols superficiels) - CODE4C : code 4 critères issu de la concaténation des champs précédents. Les valeurs prises par les différents champs pour chaque entité sont détaillées dans la méthode 4 critères (voir ressources en ligne). - UTS : Numéro d'Unité Typologique de Sol issue du Référentiel Régional Pédologique de Bretagne. Les numéros des UTS ne sont pas renseignés.
-

Classification par Spectral Angle Mapper de l'occupation des sols d'une zone d'étude agricole se trouvant dans la Beauce. Classification réalisée à partir de 13 images Radarsat-1 à raison d'une image tous les 24 jours du 14/12/2009 au 28/09/2010.
-
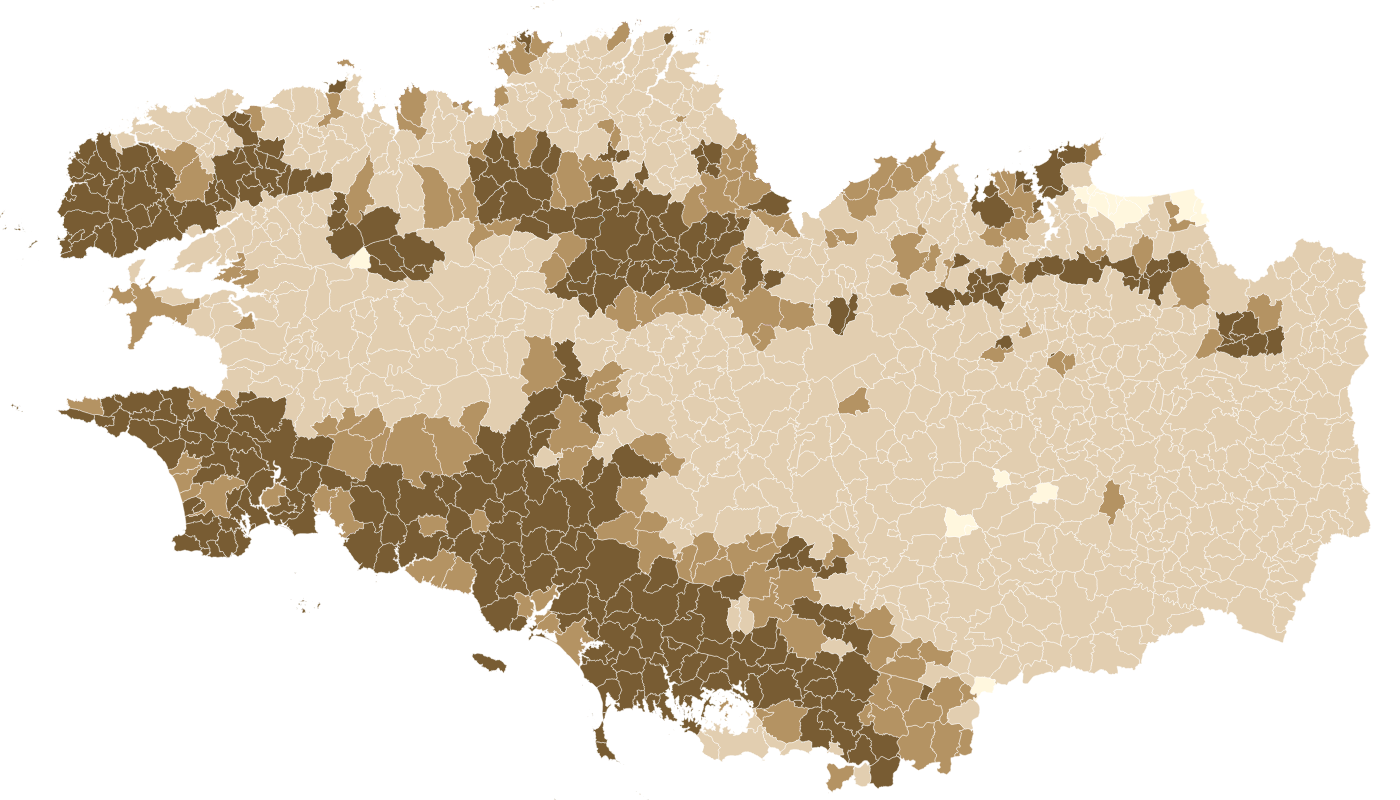
La proportion médiane de sable par commune des sols Bretagne a été estimée pour la région Bretagne à partir du Référentiel Régional Pédologique de Bretagne. Le vecteur est composé de six bandes, correspondant aux valeurs médiane de sable à six profondeurs standards : 0-15 cm, 5-15 cm, 15-30 cm, 30-60 cm, 60-100 cm et 100-200 cm. Les valeurs sont exprimées en pourcentage.
-

Un obstacle à l’écoulement est un ouvrage lié à l’eau qui est à l’origine d’une modification de l’écoulement des eaux de surface (dans les talwegs, lits mineurs et majeurs de cours d'eau et zones de submersion marine). Seuls les obstacles artificiels (provenant de l’activité humaine) sont pris en compte. Les données présentées sont issues de la couche de données ObstEcoul_FXX publiée par le SANDRE restreintes spatialement à l'emprise du bassin versant de la Sélune. Les données récupérées ont été mises à jour le 30/07/2024 à partir du flux mentionné ci-dessus et retraités pour compléter le type de l'obstacle avec un champs "nature" de l'obstacle représentant une aggrégation des types identifiés sur les valeurs suivantes : "Barrage", "Buse", "Digue", "Pont", "Seuil" et "Non renseigné". L'aggrégation mise en place pour renseigner le champ "nature" est la suivante : 1/ récupération des types d'obstacles présents sur le bassin versant (champ de la donnée source "CdTypeOuvr"). 2/ récupération des libellés associés dans la référence SANDRE : https://api.sandre.eaufrance.fr/referentiels/v1/nsa/284.csv?outputSchema=SANDREv3.1 3/ Filtre sur ces libellés pour renseigner le nouveau champ "nature" : - si le libellé contient "barrage" alors "nature" est initialisé à "Barrage" - si le libellé contient "buse" alors "nature" est initialisé à "Buse" - si le libellé contient "digue" alors "nature" est initialisé à "Digue" - si le libellé contient "pont" alors "nature" est initialisé à "Pont" - si le libellé contient "seuil" alors "nature" est initialisé à "Seuil" - si le libellé contient "non renseigné" (initialement code vide) alors "nature" est initialisé à "Non renseigné" Les autres champs proposés le jeu de données sont issus du flux SANDRE original mais renommés. La correspondance est fournie dans le dictionnaire de données associé.
-
Cadre: Carte de l'occupation parcellaire de la zone D du site de la Pleine-fougères (Zone Atelier Armorique). Programme: ECCO PNBC Date du vol: 1978
-

Les communautés microbiennes jouent un rôle majeur dans le fonctionnement des écosystèmes : elles sont à la base de la chaîne alimentaire (production primaire) et participent à la dégradation de la matière organique. Ces communautés sont, de plus, connues pour répondre rapidement à des changements environnementaux. Elles peuvent être utilisées comme indicateurs écologiques, à l'instar des macro-invertébrés. Les diatomées benthiques sont les organismes photosynthétiques majoritaires au sein de cette communauté biologique. L’abondance relative des différentes espèces permet de calculer un indice de qualité du milieu (IBD). Des fortes différences de communautés entre les zones amont et aval ont été constatés quand les barrages étant en place. Elles seront amenées à évoluer après l’effacement de ces barrages. Dans le cadre de l'observatoire Sélune ont été disposées des stations pilotes le long du cours principal de la Sélune, réparties de l’amont à l’aval des barrages hydroélectriques. Trois stations se situent dans les anciennes retenues des barrages, les deux autres, dites de référence, sont hors zone d'influence des anciens barrages (l'une étant en aval et l'autre en amont). Dans ces stations, les biocénoses aquatiques (incluant macroinvertébrés benthiques, biofilms, macrophytes...) sont suivies. Depuis septembre 2014, les stations sont idéalement échantillonnées tous les mois d’Avril à Octobre (7 relevés annuels) à l'aide de substrats artificiels (lames de verre disposées dans l'eau). En plus du relevé des diatomées (liste floristique, calcul de l'IBD), la concentration en chlorophylle-a est mesurée. Cette couche donne la localisation des secteurs d'étude utilisés dans le suivi des biofilms photosynthétiques ainsi que les campagnes réalisées.
-

Objectif : Etude de l’effet de l’hétérogénéité de la mosaïque des cultures sur la biodiversité et les services écosystémiques Protocole : Occupation du sol réalisée par inventaire terrain Article de référence : à venir Programme de Recherche : ERA-Net BiodivERsA, Farmland
-
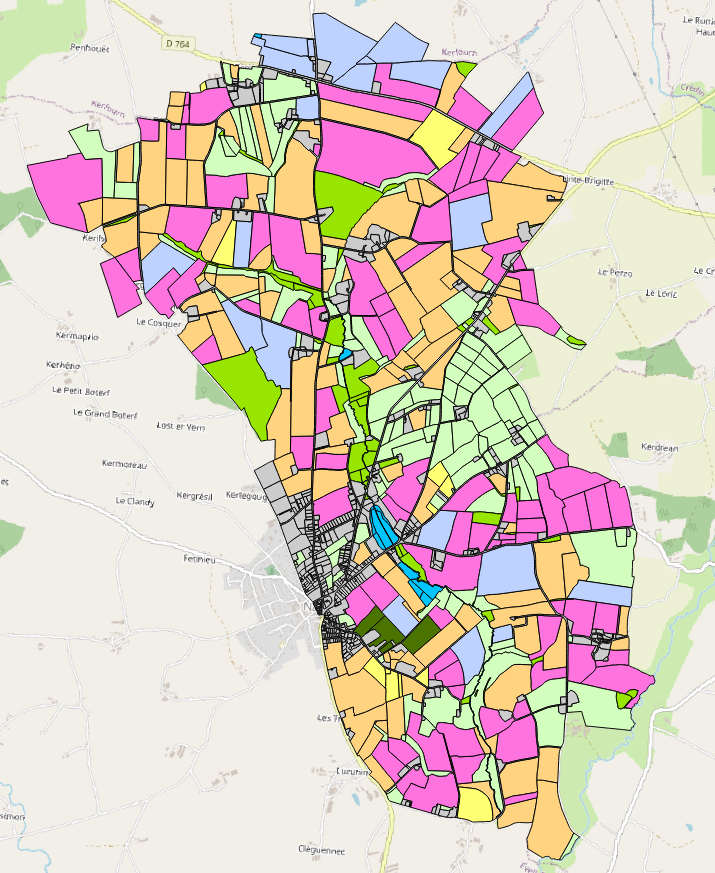
Occupation des sols 2017 du bassin versant du site de Naizin dans le Morbihan dans le cadre de l'Observatoire de Recherche en Environnement (ORE) AgrHyS d'INRAE. Le parcellaire est issu du cadastre de 2013. Les dessertes ont été redessinées à partir des orthophotos IGN de 2013 et le parcellaire a été découpé en fonction d’une zone tampon autour de ces dessertes. Les parcelles 2013 peuvent être découpées mais jamais regroupées. Toutes les entités géographiques élémentaires ont un identifiant unique sur l’ensemble des années. Champs de la table d’attribut : • ID_2017 : identifiant de la parcelle pour l’année 2017 • TYPE_17 : code principal de l’occupation des sols • S_TYPE_17 : code secondaire de l’occupation des sols • ID_PARCEL : Identifiant numérique et non significatif par parcelle du RPG 2017 • CODE_GROUP : code du groupe de cultures du RPG 2017 • CODE_CULTU : code du groupe de cultures majoritaire du RPG 2017 • CULTURE_D1 : code de la culture dérobée (culture intercalée entre 2 moissons de culture principale) sur la parcelle. • CULTURE_D2 : code de la seconde culture dérobée (culture intercalée entre 2 moissons de culture principale). La nomenclature de ces codes des types et sous-types a été définie dans le programme ANR-12-AGRO-0005 MOSAIC : https://anr.fr/Projet-ANR-12-AGRO-0005. Leurs descriptions peuvent être télécharger ici : https://geosas.fr/metadata/ore/xls/legendes_osol_naizin.xlsx. Les occupations des sols sont issues des données par parcelles du Registre Parcellaire Graphique (RPG) de l’année 2017. Les limites des parcelles ont été mises en concordance avec le parcellaire de 2013.
-

Map of existing and lost wetlands of the Couesnon watershed, derived from a Sentinel-1 and 2 time-series classification. Natural vegetations classes (C3.1, C3.2, D1.1, E3.41, G1.2, I1.1 and J EUNIS classes) were assigned to existing wetlands whereas other land cover classes (C, I1.1, J) were reclassified as lost wetlands.