 OSURIS
geoscientificInformation
GEMET keywords
Type of resources
Available actions
Topics
INSPIRE themes
Keywords
Contact for the resource
Provided by
Years
Formats
Representation types
Update frequencies
status
Scale
Resolution
-
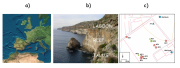
Le site de Majorque est situé à Ses Sitjoles (12 000 m2), au SE de l’île. Il s’agit d’un aquifère en domaine carbonaté récifal (Miocène) très perméable, présentant quelques cavités kartisques à échelle métrique. Dans cette zone, l’agriculture intensive et l’irrigation provoquent une surexploitation des nappes phréatiques qui a pour conséquence l’intrusion d’eau saline jusqu’à 15 km à l’intérieur de l’île, et donc la pollution des nappes en chlorure. Le site expérimental comprend un réseau de 12 forages profonds (100 m), dont 6 entièrement carottés. le site est suivi par une équipe de l'UMR Géosciences Montpellier pour : La caractérisation in-situ du site par des campagnes de mesures en forage : structure géologique traversée (imagerie de parois), caractérisation pétrophysique (électrique, acoustique, radioactivité naturelle) et caractérisation des écoulements par des méthodes hydrogéophysiques (débit, potentiel spontanée, comportement hydro-dispersif,…) La caractérisation pétrophysique et tomographique RX des carottes Le suivi continu in-situ du réservoir avec de nouveaux observatoires géophysiques (igeo-SER) permettant une mesure périodique (horaire ou quotidienne) de paramètres tels que la résistivité électrique ou le potentiel électrocinétique, et hydrodynamique (piézomètres Hydreka) pour une mesure des champs de pression, de température, ainsi que de la charge ionique des fluides in-situ. L’échantillonnage régulier puis l'analyse des fluides in-situ. L’analyse des données de suivi in-situ pour étudier la réponse du réservoir aux sollicitations extérieures aussi bien naturelles (climatiques, tectoniques, pompages,...) qu’induites dans le cadre d’expériences (injection d’un traceur, d’écoulement longue durée). La simulation et modélisation des processus de transfert dans le réservoir.
-
Le site d’Hyderabad (Inde) est situé dans un aquifère cristallin altéré et fracturé soumis à de fortes pressions anthropiques (pompages, intrants…) induites par les pratiques agricoles. Le site de Choutuppal (43 ha) constitue un observatoire expérimental local disposant d’une vingtaine de piézomètres entre lesquels des essais de pompages en interférences et essais de traçages peuvent être réalisés. Le bassin versant de Maheshwaram (55 km2) est caractérisé par une très forte activité agricole impactant le cycle de l’eau, le niveau de la nappe aquifère et sa qualité. Plusieurs centaines de forages abandonnés sont disponibles pour réaliser diverses investigations. Les questionnements scientifiques sont la compartimentation/hétérogénéité de l’aquifère de socle, les relations entre propriétés hydrodynamiques et paramètres de transport et finalement l’évolution de la composition chimique de l’eau souterraine en lien avec les activités anthropiques et le changement climatique. Les problèmes essentiels concernent la vulnérabilité de la population à la disponibilité de la ressource et sa qualité altérées par les activités anthropiques Le partenaire du site est le National Geophysical Research Institute qui possède le foncier de Choutuppal et possède un accord de collaboration avec les chefs de villages à Maheshwaram.
-
Le Site Expérimental Hydrogéologique (SEH) de Poitiers a été développé par l’équipe Hydrasa (FRE 3114), dans le cadre du Réseau National de Sites Hydrogéologiques (SNO H+) et du programme "EAUX" de la région Poitou-Charentes (CPER 2002-2006). Situé 2 km à l’Est du Campus Sciences de l’Université de Poitiers, le SEH couvre une superficie de 12 hectares sur des terrains appartenant à l’Université (Site du Deffend : Observatoire Régional du Patrimoine Végétal). D’un point de vue géologique, le SEH est implanté sur le versant nord du « Seuil du Poitou », vaste plateau carbonaté Mésozoïque marquant la transition entre les bassins sédimentaires Aquitain et Parisien.
-
Le site de Plœmeur (Morbihan) correspond à un aquifère exploité depuis 1991 en domaine cristallin fracturé, qui fournit ~ 1 million de m3 par an pour l’alimentation en eau potable d’une ville de 20000 habitants. La qualité chimique de l’eau extraite est très bonne, elle est notamment caractérisée par un faible taux de nitrates dans une région pourtant fortement touchée par les pollutions diffuses. Bien que les roches présentes soient constituées de granites et de micaschistes, roches classiquement considérées comme peu perméables, on observe des écoulements très rapides, localisés dans quelques zones fracturées. Les problèmes essentiels concernent la vulnérabilité de l’aquifère vis à vis des transferts de polluants anthropiques, les risques éventuels de salinisation de cet aquifère côtier, et la définition des zones de recharge en lien avec la mise en place d’un périmètre de protection. Ce site dispose d’une couverture piézométrique très dense avec une cinquantaine de forages de 30 à 150 m de profondeur. Ce dispositif permet de réaliser des suivis long terme – hydrologiques, hydrochimiques et géophysiques – et des expérimentations innovantes sur les propriétés hydrologiques des milieux hétérogènes.
-
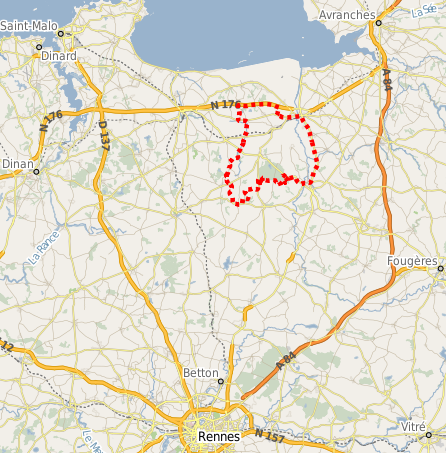
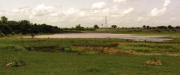
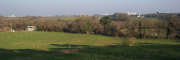
L’entité bocagère de la Zone Atelier Armorique (ZAAR) est située au niveau du canton de Pleine-Fougères (depuis 1993). La zone bocagère est caractérisée par un gradient paysager allant d’un bocage dense avec des parcelles petites bordées de haies à un bocage lâche. Les haies bordant les parcelles sont le plus souvent constituées d’arbres émondés en ragosses, de chênes avec parfois quelques châtaigniers émondés et des chênes en haut jet, mais aussi de cépées de châtaigniers. Depuis 2005, en raison de l’introduction de conditions de protection de l’environnement dans la Politique Agricole Commune, la plupart des cours d’eau sont bordés de bandes enherbées.
-
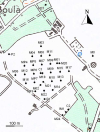
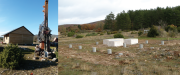
La couche station représente la position géographique des stations sur lesquelles peuvent être effectuées des mesures de déformation (gravimétrie, inclinométrie), des mesures liées au site (données météo, données de rivière) ou bien des mesures d'écoulement dans le cas où la station se trouve sous terre. Ce sont des chroniques (données météo), des mesures ponctuelles ou bien des mesures issues d'expériences.
-
La couche puits represente la position geographique des puits sur lesquels sont effectuées des mesures chimiques, in situ (geophysique, imagerie ...), hydrauliques. Ce sont des chroniques ou bien des mesures issues d'expériences (dilution, essai de pompage ...)
-
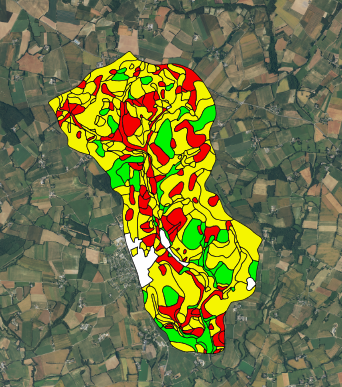
La carte représente la pédologie du site d'étude INRA de Naizin.
-
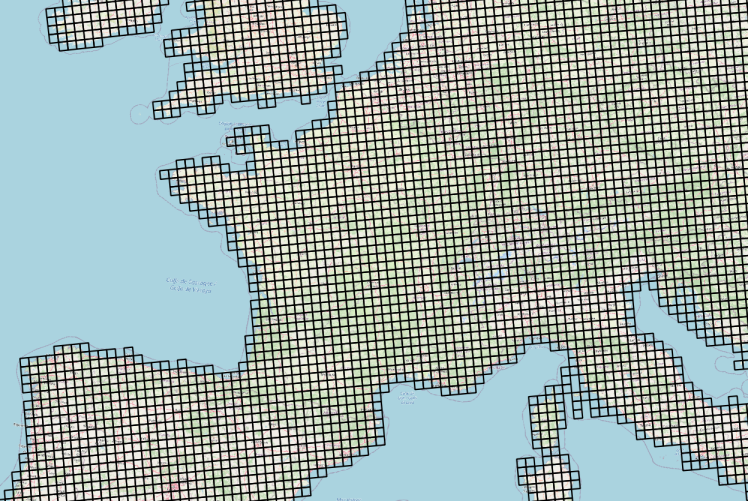
Données météorologiques Agri4cast basées sur des observations et spatialisées sous la forme d'une grille composée de mailles carrées de 625 km² (25 km ×25 km) sur la France. La table attributaire de cette couche permet d'établir le lien entre l'objet géographique (la maille) et les chroniques d'observation météorologiques via un service conforme au standard OGC SensorThings (https://frost.geosas.fr/agri4cast/v1.0/) Les observations sont : - température maximale de l'air (°C), - température minimale de l'air (°C), - température moyenne de l'air (°C), - vitesse moyenne quotidienne du vent à 10 m (m/s), - pression atmosphérique (hPa), - précipitations cumulées (mm/jour), - évapotranspiration potentielle d'un couvert végétal (mm/jour), - rayonnement global total (KJ/m2/jour). Les données météorologiques sont quotidiennes de 1979 à la dernière année civile révolue. Plus d’informations sur le portal Agri4cast : https://agri4cast.jrc.ec.europa.eu/DataPortal/Index.aspx
-
Le site du Durzon correspond à un aquifère karstique d’une superficie de 100 km2 qui alimente la source du Durzon (débit moyen 1.4 m3/s). Cette source fournit de façon naturelle l’alimentation en eau potable de la partie aveyronnaise du Larzac. Ce site dispose d’un suivi du débit de la source (Parc Naturel des Grands Causses). Le laboratoire Géosciences Montpellier assure un suivi pluviométrique, la mesure des écoulements souterrains, la mesure des déformations associées à la recharge par inclinométrie, et la mesure de la gravité sur des sites aériens et souterrains. Des suivis hydrologiques et géochimiques complémentaires sont assurés par le laboratoire Hydrosciences Montpellier.